Using Systemd-Analyze to Understand Boot Process
Some handy tips for identifying the boot process of systemd based init devices. Specifically how to use systemd-analyze to identify slowest stating services and all of the dependencies of the system and user login processes.
systemd-analyze
Systemd-analyze command is used to determine system boot-up performance statistics and other state and tracing information from the system and service manager, and to verify the correctness of unit files.
systemd-analyze switches I find useful
- systemd-analyze time
systemd-analyze timemeasures the time from start to when all system services have been spawned, though not necessarily when they have finished initialization.$ systemd-analyze time Startup finished in 1min 39.916s (kernel) + 45.380s (userspace) = 2min 25.297s graphical.target reached after 44.945s in userspace $ - systemd-analyze blame
systemd-analyze blameprints a list of all running units, ordered by the time they took to initialize. This information may be used to optimize boot-up times.$ systemd-analyze blame 21.359s mariadb.service 16.840s systemd-networkd-wait-online.service 10.937s winbindd.service 10.629s accounts-daemon.service 10.232s systemd-tmpfiles-clean.service 10.161s transmission-daemon.service 8.596s polkit.service 8.435s systemd-journal-flush.service 6.739s slapd.service 5.621s squid-cjg.service 4.895s upower.service 4.396s dev-dm\x2d1.device 4.088s iptables-restore.service 4.078s freshclamd.service 3.786s systemd-logind.service ... - systemd-analyze critical-chain
systemd-analyze critical-chainprints a tree of the time critical chain of units for the default target.
 $ systemd-analyze critical-chain
 The time when unit became active or started is printed after the "@" character.
 The time the unit took to start is printed after the "+" character.

 graphical.target @44.945s
 └─multi-user.target @44.944s
   └─mariadb.service @23.584s +21.359s
     └─network.target @23.435s
       └─systemd-resolved.service @22.985s +448ms
         └─systemd-networkd.service @22.143s +839ms
           └─network-pre.target @22.140s
- systemd-analyze plot > /tmp/systemd-boot.svc
systemd-analyze plotcreates an SVG graphic detailing which system services were started and at what time, showing total time spent initializing.$ systemd-analyze plot > /tmp/systemd-boot.svg $ display /tmp/systemd-boot.svg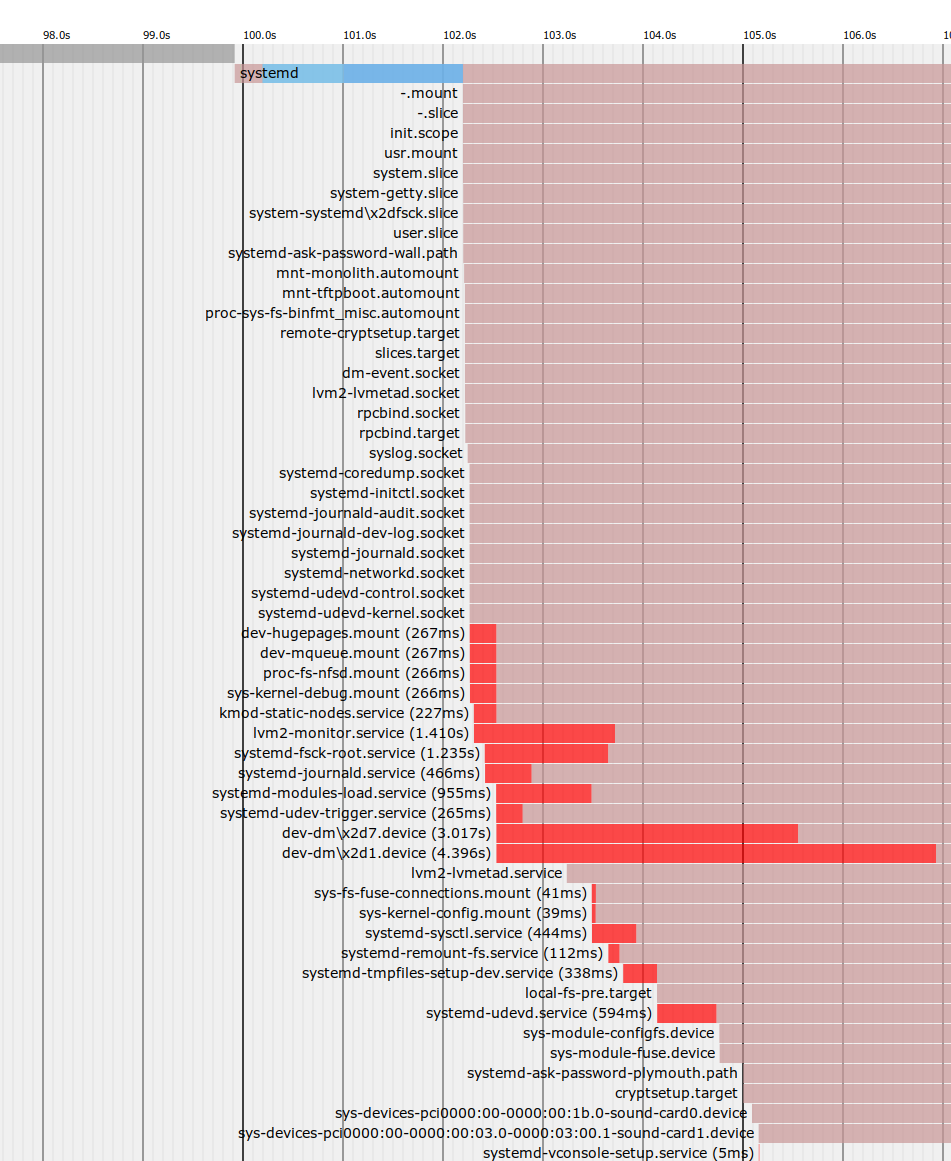
- systemd-analyze dot
system-analyze dot --ordercommand generates textual dependency graph description in dot format for further processing with the GraphViz tool.$ systemd-analyze dot | dot -T svg > /tmp/systemd-boot-gv-system.svg $ systemd-analyze dot | dot -T svg > /tmp/systemd-boot-gv-system.svg $ systemd-analyze dot | dot -T svg > /tmp/systemd-boot-gv-system.svg Color legend: black = Requires dark blue = Requisite dark grey = Wants red = Conflicts green = After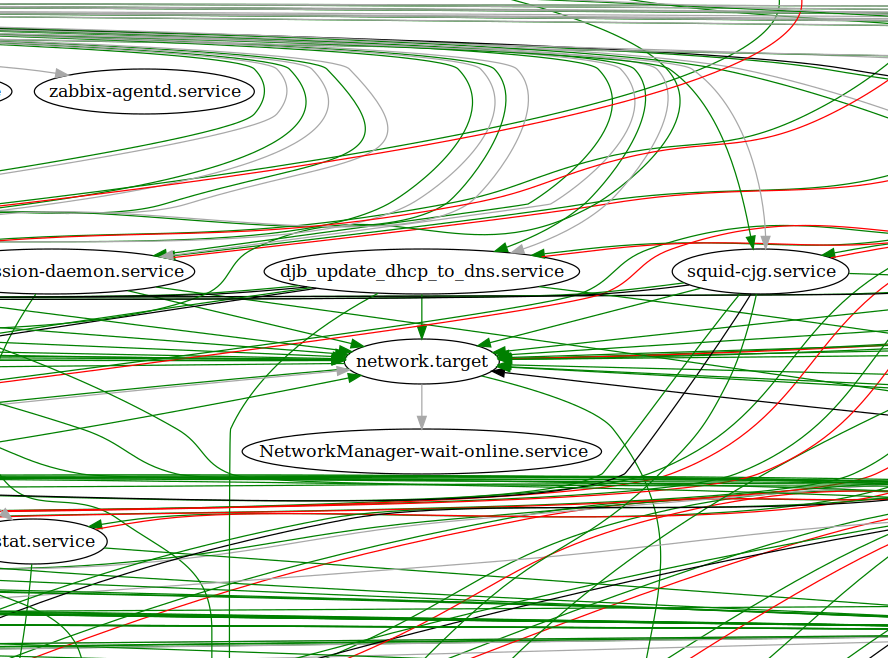
As always it remains a generally good idea to read the fine manual form more details and in depth information.

Chrls is currently a technology transformation leader at one of the oldest American investment banking services holding companies, headquartered in New York City. Previous roles at current employer include project manager, front office support, retail and enterprise global Windows server support. Currently residing in Tennessee on the Cumberland Plateau and enjoying life, family and open source.
Mastodon Funkwhale