Grafana Install Via Salt
Notes on installation and configuration of Grafana via Saltstack for future me. This a companion for a previous post, I covered how I istalled Prometheus and node_exporter on my machines via Salt. Grafana povides convienient dashboards through which to visualize data collected by Prometheus (and other tools).
Installation
Grafana is not an officially supported package on on Arch Linux, yet that is the platform on which I will be running it from, so I am opting to install standalone Linux binaries for ARM64, which were retrieved according to the directions on the Grafana website.
cd /opt/projects
sudo mkdir grafana
cd grafana
sudo wget https://dl.grafana.com/oss/release/grafana-8.3.3.linux-arm64.tar.gz
sudo tar -zxvf grafana-8.3.3.linux-arm64.tar.gz
At this point it is simply a matter of issuing the command ./bin/grafana-server from the install directory grafana-8.3.3 and then visiting the Grafana portal in a web browser pointed to the server where installed on port 3000.

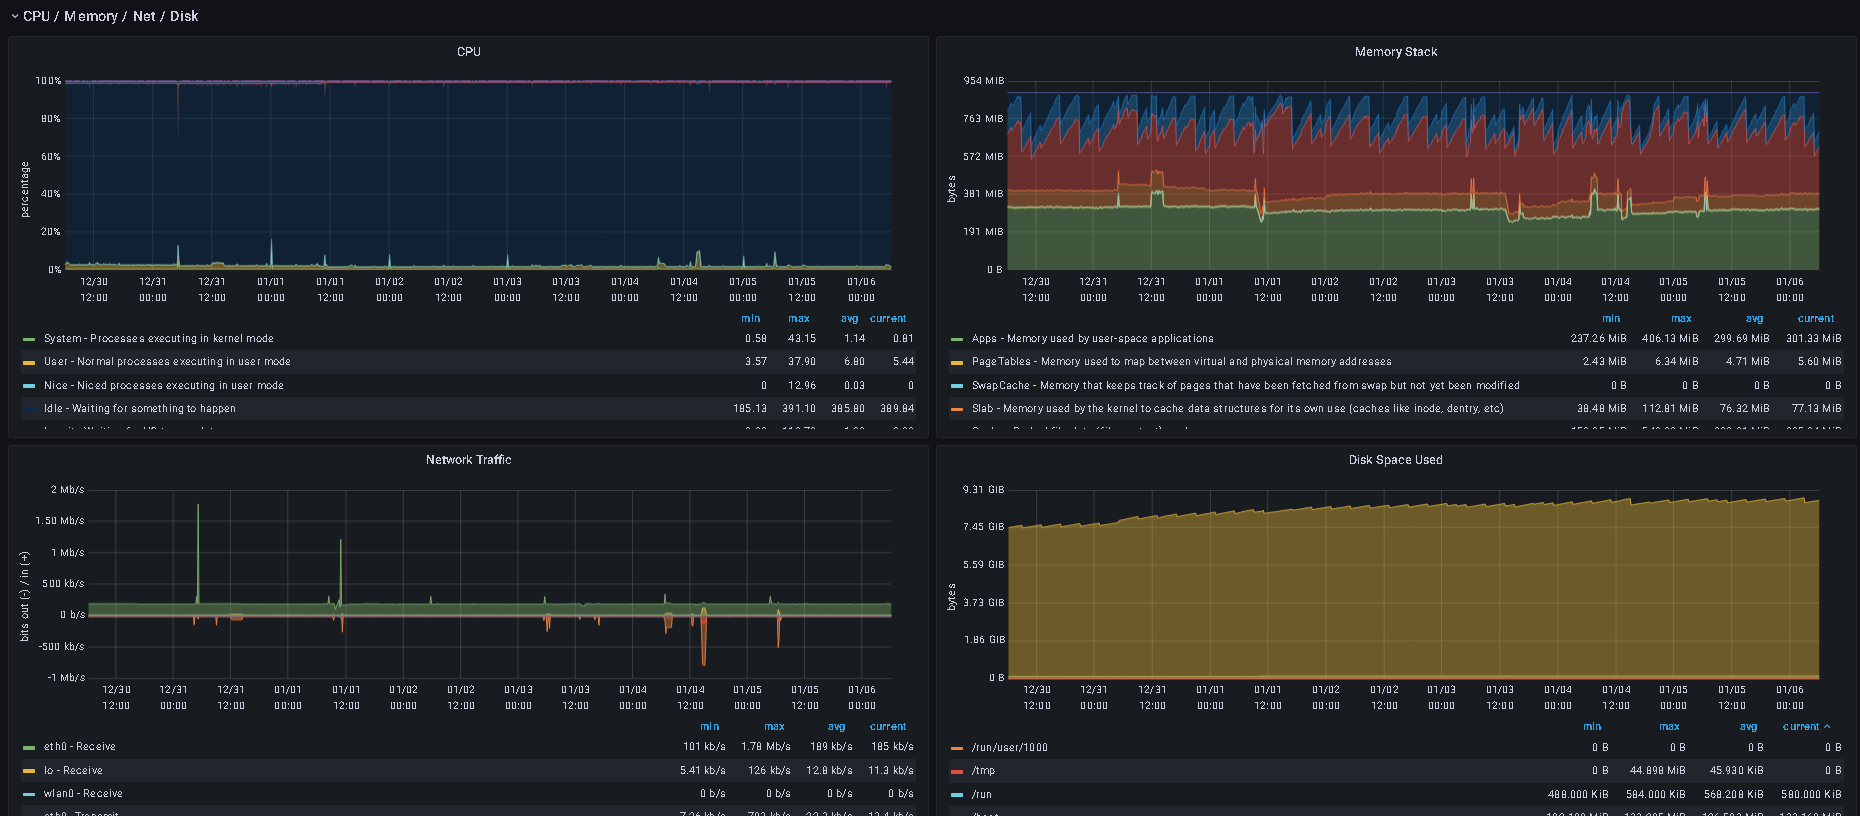
After logging into Grafana, setting a non default password, and setting up a Datasource connection to my Prometheus server, dashboards like the following become available.

Automating Installation with Salt
While the manual install wasn’t bad, as always I like to script the install so I can repeat it in the future without having to remember or research all the steps again. I use Salt as my home orcheststration tool and the files below are what I am using to install and configure Grafana so that it runs as a service restarting automatically and when the machine restarts.
The state file I created has been aded to the base file of the machine on which it is installed, and will be included if I rebuild the machine. The state can also be used to install on additional machines if needed, and will provide an easy foundation on which to script instalations of newer versions and to other platforms.
While there is clearly room for improvement in my approach, the below meets my needs of the moment, and as a thought leader once explained to me, “up and running always beats upcoming”.
With no further ado, the command I use to instll Grafana with the below Salt state and configuration files is su -c 'salt ceed-chuck state.apply app_grafana test=False'.
Of course I failed to capture output from the initial install, so all I can offer is the output of a second run which found everything in place and as expected and so made no actual changes.
ceed-chuck:
----------
          ID: grafana
    Function: user.present
      Result: True
     Comment: User grafana is present and up to date
     Started: 13:00:18.593364
    Duration: 165.116 ms
     Changes:
----------
          ID: graphana_inst
    Function: archive.extracted
        Name: /opt/projects/grafana/
      Result: True
     Comment: Path /opt/projects/grafana/grafana-8.3.3/ exists
     Started: 13:00:18.872984
    Duration: 8.022 ms
     Changes:
----------
          ID: grafana_environment
    Function: file.managed
        Name: /etc/default/grafana-server
      Result: True
     Comment: File /etc/default/grafana-server is in the correct state
     Started: 13:00:18.997508
    Duration: 208.265 ms
     Changes:
----------
          ID: grafana_systemd
    Function: file.managed
        Name: /etc/systemd/system/grafana-server.service
      Result: True
     Comment: File /etc/systemd/system/grafana-server.service is in the correct state
     Started: 13:00:19.316626
    Duration: 75.125 ms
     Changes:
----------
          ID: grafana_config
    Function: file.copy
        Name: /opt/projects/grafana/grafana-8.3.3/conf/grafana.ini
      Result: True
     Comment: The target file "/opt/projects/grafana/grafana-8.3.3/conf/grafana.ini" exists and will not be overwritten
     Started: 13:00:19.496792
    Duration: 12.117 ms
     Changes:
----------
          ID: grafana_svc
    Function: service.running
        Name: grafana-server.service
      Result: True
     Comment: The service grafana-server.service is already running
     Started: 13:00:19.774219
    Duration: 135.757 ms
     Changes:

Summary for ceed-chuck
------------
Succeeded: 6
Failed:    0
------------
Total states run:     6
Total run time: 604.402 ms
Salt app_grafana
File system layout for app_grafana
/srv/salt/app_grafana/
├── files
│   ├── grafana-8.3.3.linux-arm64.tar.gz
│   ├── grafana-server
│   └── grafana-server.service
└── init.sls
init.sls
This is the file that does all the installation and configuration work on the Salt minion.
# Installs Grafana for monitoring metrics from Prometheus
# Created: 2021-10-22
# Tested on ArchArm Linux

# Make sure grafana user and group are present
grafana:
  user.present:
    - fullname: grafana service
    - shell: /usr/bin/nologin
    - createhome: False
    - system: True
    - usergroup: True

# Extract grfana software
graphana_inst:
  archive.extracted:
    - name: /opt/projects/grafana/
    - source: salt://app_grafana/files/grafana-8.3.3.linux-arm64.tar.gz
    - souce_hash: SHA256=6252917d7e63eb47e0955125b3b2c1c5d3e4d2e3bb84c269a8d86bd073a1dce7
    - keep_source: False
    - user: grafana
    - group: grafana
    - if_missing: /opt/projects/grafana/grafana-8.3.3/
    - trim_output: True

grafana_environment:
  file.managed:
    - name: /etc/default/grafana-server
    - source: salt://app_grafana/files/grafana-server

grafana_systemd:
  file.managed:
    - name: /etc/systemd/system/grafana-server.service
    - source: salt://app_grafana/files/grafana-server.service

grafana_config:
  file.copy:
    - name: /opt/projects/grafana/grafana-8.3.3/conf/grafana.ini
    - source: /opt/projects/grafana/grafana-8.3.3/conf/defaults.ini

# Make sure service is enabled and started.
grafana_svc:
  service.running:
    - name: grafana-server.service
    - enable: True
    - watch:
      - file: /etc/systemd/system/grafana-server.service
      - file: /etc/default/grafana-server
      - file: /opt/projects/grafana/grafana-8.3.3/conf/grafana.ini
grafana-server.service
This is the SystemD service file I am using currently. It is almost exactly as on Grafana GitHub for RPM packaging, with changes to EnvironmentFile=, WorkingDirectory=, and ExecStart= settings to mat my install location and personal preferences.
[Unit]
Description=Grafana instance
Documentation=http://docs.grafana.org
Wants=network-online.target
After=network-online.target
After=postgresql.service mariadb.service mysqld.service

[Service]
EnvironmentFile=/etc/default/grafana-server
User=grafana
Group=grafana
Type=notify
Restart=on-failure
WorkingDirectory=/opt/projects/grafana/grafana-8.3.3
RuntimeDirectory=grafana
RuntimeDirectoryMode=0750
ExecStart=/opt/projects/grafana/grafana-8.3.3/bin/grafana-server \
                            --config=${CONF_FILE}                \
                            --pidfile=${PID_FILE_DIR}/grafana-server.pid  \
#                           --packaging=rpm                       \
                            cfg:default.paths.logs=${LOG_DIR}      \
                            cfg:default.paths.data=${DATA_DIR}     \
                            cfg:default.paths.plugins=${PLUGINS_DIR} \
                            cfg:default.paths.provisioning=${PROVISIONING_CFG_DIR}

LimitNOFILE=10000
TimeoutStopSec=20
CapabilityBoundingSet=
DeviceAllow=
LockPersonality=true
MemoryDenyWriteExecute=false
NoNewPrivileges=true
PrivateDevices=true
PrivateTmp=true
ProtectClock=true
ProtectControlGroups=true
ProtectHome=true
ProtectHostname=true
ProtectKernelLogs=true
ProtectKernelModules=true
ProtectKernelTunables=true
ProtectProc=invisible
ProtectSystem=full
RemoveIPC=true
RestrictAddressFamilies=AF_INET AF_INET6 AF_UNIX
RestrictNamespaces=true
RestrictRealtime=true
RestrictSUIDSGID=true
SystemCallArchitectures=native
UMask=0027

[Install]
WantedBy=multi-user.target
grafana-server
This is the file that sets the environment variables used by the grafana-server.service for Systemd to start the service using my desired paths and configuration files.
GRAFANA_USER=grafana

GRAFANA_GROUP=grafana

GRAFANA_HOME=/opt/projects/grafana/grafana-8.3.3

LOG_DIR=/var/log/grafana

DATA_DIR=/opt/projects/grafana/grafana-8.3.3/data

WORK_DIR=/opt/projects/grafana/grafana-8.3.3

CONF_DIR=/opt/projects/grafana/grafana-8.3.3/conf

CONF_FILE=/opt/projects/grafana/grafana-8.3.3/conf/grafana.ini

RESTART_ON_UPGRADE=true

PLUGINS_DIR=/opt/projects/grafana/grafana-8.3.3/data/plugins

#PROVISIONING_CFG_DIR=/etc/grafana/provisioning

# Only used on systemd systems
PID_FILE_DIR=/var/run/grafana
References
Comments
You can use a Mastodon accounti to comment on this article by replying to the associated Mastodon toot.
