Vagrant Process as Graphviz Diagram
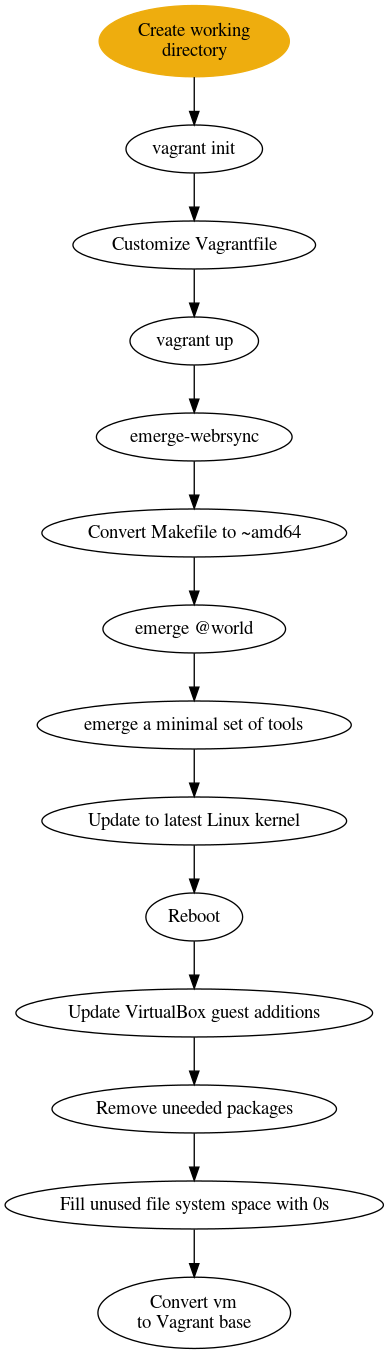
I have bee using Graphviz - Graph Visualization Software more both at home and work in the hope of becoming more proficient in its use. As an exercise I have converted the Vagrant ordered list from /tech/todo/2014/11/11/thatwhichisgoingonnow.html post into the diagram below.
1
2
3
4
5
6
7
8
9
10
11
12
13
14
15
16
17
18
19
20
21
22
23
24
25
26
27
28
29
digraph gentoo_vm {
	wrk_dir -> init;
	init -> custom;
	custom -> up;
	up -> switch;
	switch -> unstable;
	unstable -> update;
	update -> essentials;
	essentials -> kernel;
	kernel -> reboot;
	reboot -> vb_additions;
	vb_additions -> purge;
    purge -> zero;
	zero -> build_vb;
    wrk_dir [label="Create working\ndirectory", shape=ellipse, color=darkgoldenrod2, style=filled ];
    init [label="vagrant init" ];
    custom [label="Customize Vagrantfile" ];
    up [label="vagrant up" ];
    switch [label="emerge-webrsync" ];
    unstable [label="Convert Makefile to ~amd64" ];
    update [label="emerge @world" ];
    essentials [label="emerge a minimal set of tools" ];
    kernel [label="Update to latest Linux kernel" ];
    reboot [label="Reboot" ];
    vb_additions [label="Update VirtualBox guest additions" ];
    purge [label="Remove uneeded packages" ];
    zero [label="Fill unused file system space with 0s" ];
    build_vb [label="Convert vm\nto Vagrant base" ];
}

Chrls is currently a technology transformation leader at one of the oldest American investment banking services holding companies, headquartered in New York City. Previous roles at current employer include project manager, front office support, retail and enterprise global Windows server support. Currently residing in Tennessee on the Cumberland Plateau and enjoying life, family and open source.
Mastodon Funkwhale